Introduction
The World Cup 2023 has come to an end – time to talk about some football physics!
One of the most impressive demonstrations of the Magnus effect in sports is the free kick from Roberto Carlos. On June 3rd, 1997, Carlos set up for a 35 meter free kick. In a weird position that is nowhere near what we would expect, all by intuition. The combination of turbulence and the Magnus effect made it incredibly difficult for France’s goalkeeper Barthez to move, let alone to hold the ball.
Roberto's arguably most famous goal of his career!
“There are lots of good kickers nowadays, it might take some time but someday someone will score a similar goal. But I was the first.” – Roberto Carlos

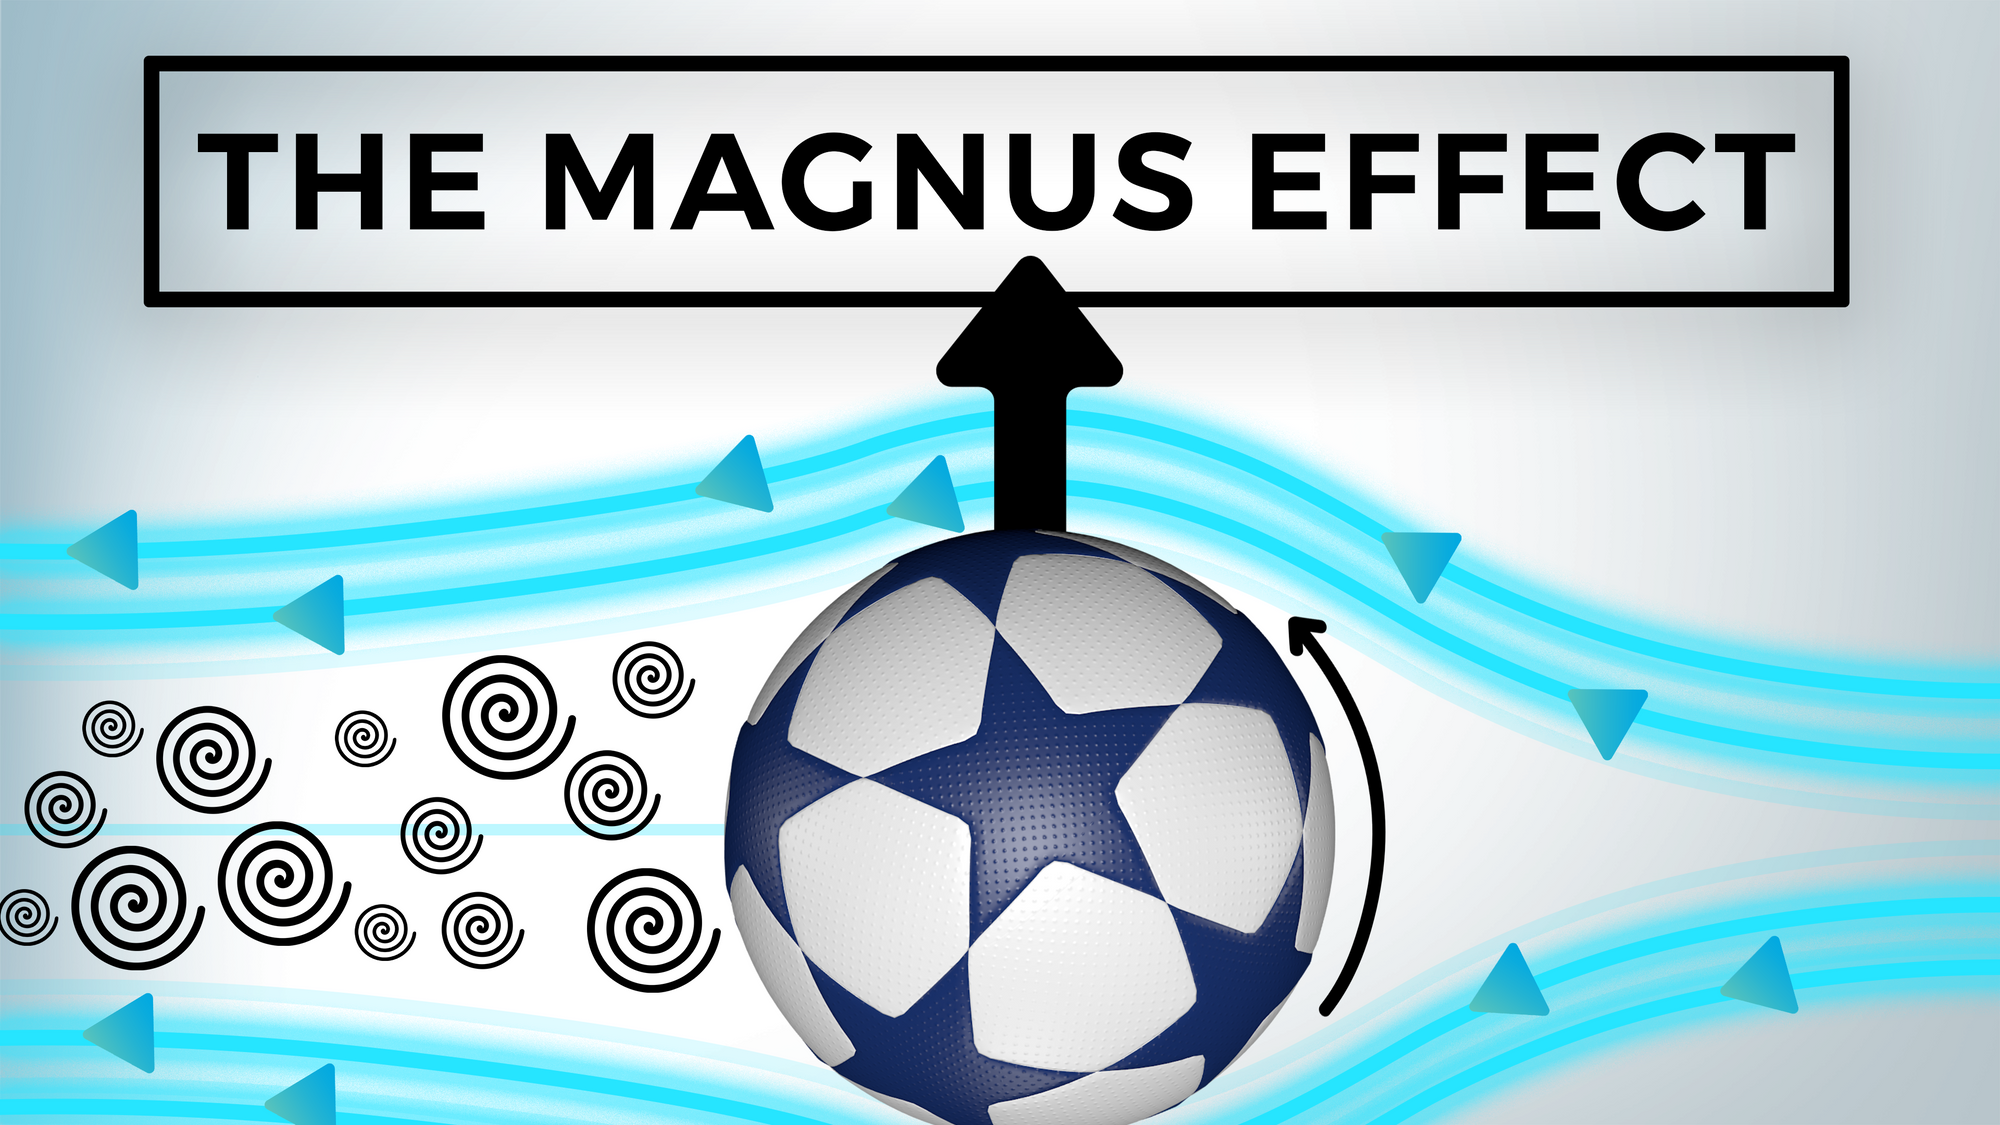
In a nutshell, the Magnus effect is caused by a rotating object carrying the boundary layer into the flow on the side of the ball rotating into the flow. This results in an increase of pressure and inversely a decrease of pressure on the other side. We will also cover why the design of the ball’s surface is so important for its trajectory.
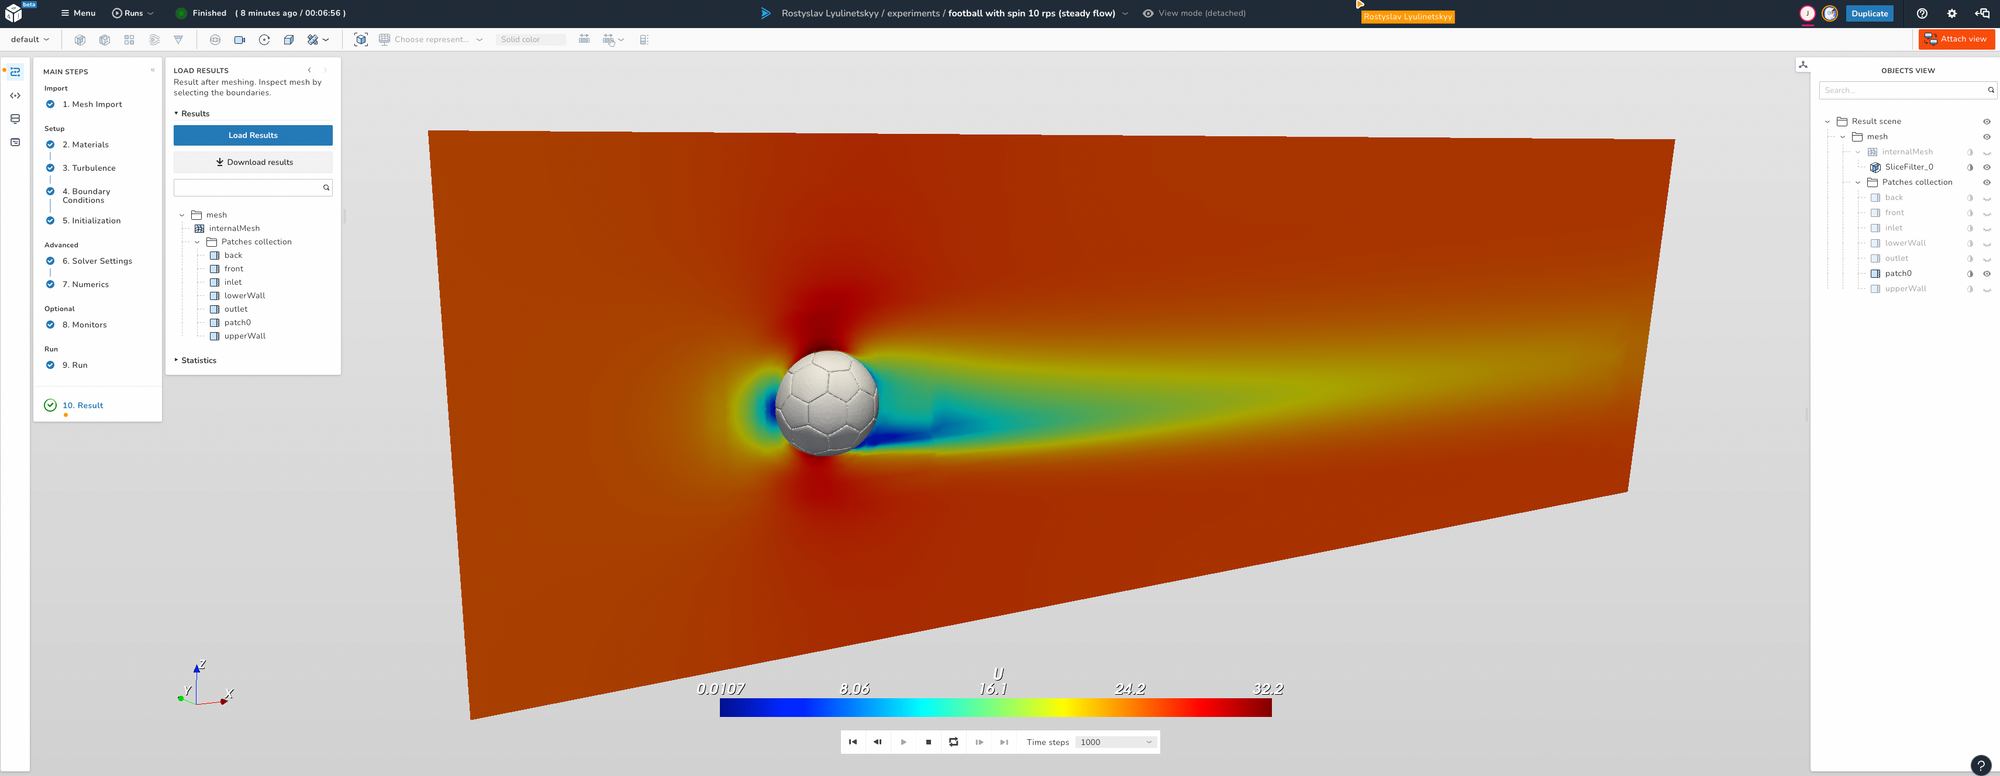
In this first blog, I am explaining the physics behind this phenomenon and will use visualisations created using Computational Fluid Dynamics (CFD), a mathematical process of modelling physical phenomena involving fluid flow and solving it numerically using dicehub.
In the second part, we will delve into the actual ball design and what role turbulence plays for different types of balls. Don't miss this!
Historical Background ⏳
The Magnus (sometimes Robins) effect, describes the curvature of trajectory. The first explanation of the lateral deflection on a spinning object has already been observed around 1671 by Sir Issac Newton, and received its final name after Dr. Heinrich Magnus who qualitatively described the phenomenon in 1852.
Arguably, one can call the effect Robins effect or at least Robins-Magnus effect as Benjamin Robins explained long before Magnus the phenomena in "Principles of Gunnery" (1742) investigating cannon balls.
The link made to sport in this article is not by accident as it is said that Sir Isaac Newton (1672) discovered the effect during tennis competitions where he was able to determine that the turn of the ball depends on the speed of rotation, again by Lord Rayleigh (1877), who remarked “...a rapidly rotating ball moving through the air will often deviate considerably from the vertical plane.”
The first theoretical description of the effect was presented by Lord Rayleigh, whose theory predicted that the lift is proportional to the product of the speeds of rotation and translation. However, it was not until the theory of boundary layers, the thin layer of flow close to the surface, developed by Ludwig Prandtl (1904; also Schlichting 1955, Anderson 2005), that the subtlety of the effect could be fully appreciated. Source
A Visual Explanation 🤔
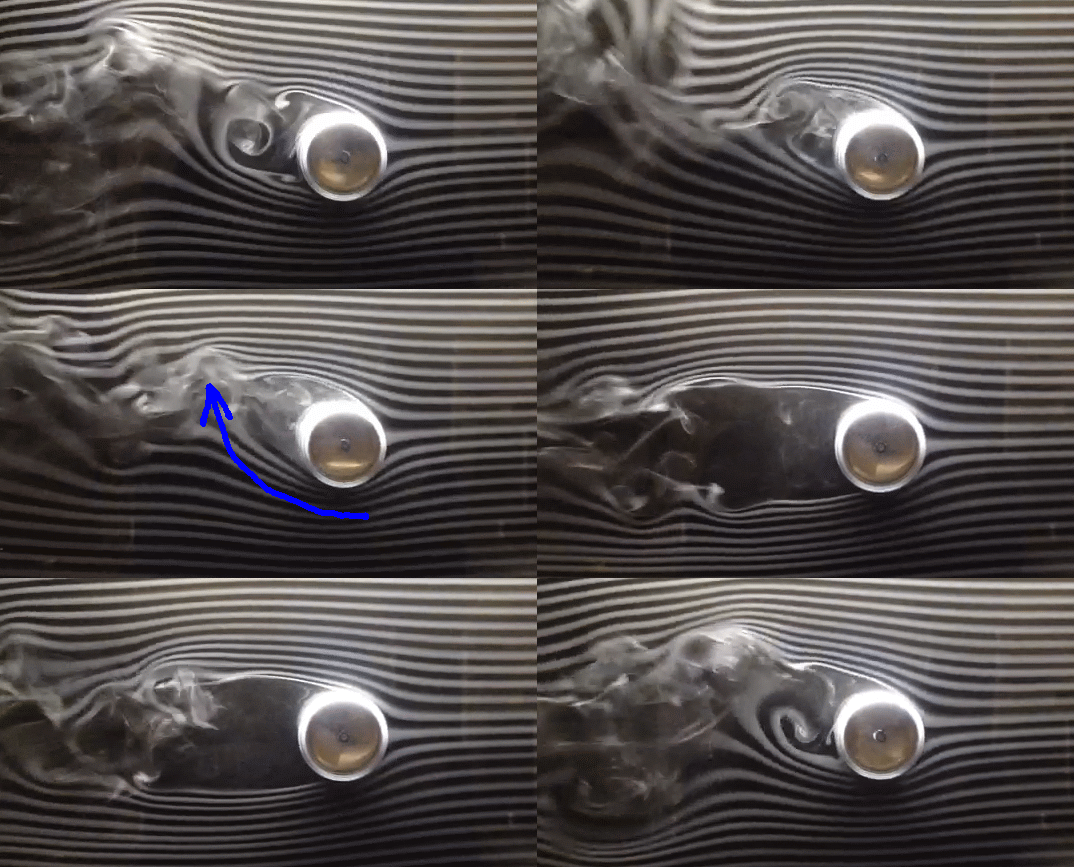
In the visualisation below, the top spinning cylinder "pulls" the airflow up and the air in turn pulls the cylinder down, as per Newton's Third Law.
Let's have a look at a ball that is spinning around the axis perpendicular to the flow of air across. The air travels faster relative to the centre of the ball where the periphery of the ball is moving in the same direction as the airflow. This reduces the pressure, according to Bernoulli’s principle. The opposite effect happens on the other side of the ball, where the air travels slower relative to the centre of the ball. There is therefore an imbalance in the forces and the ball deflects – or, as Sir J J Thomson put it in 1910, “the ball follows its nose”. This lateral deflection of a ball in flight is generally known as the “Magnus effect”.
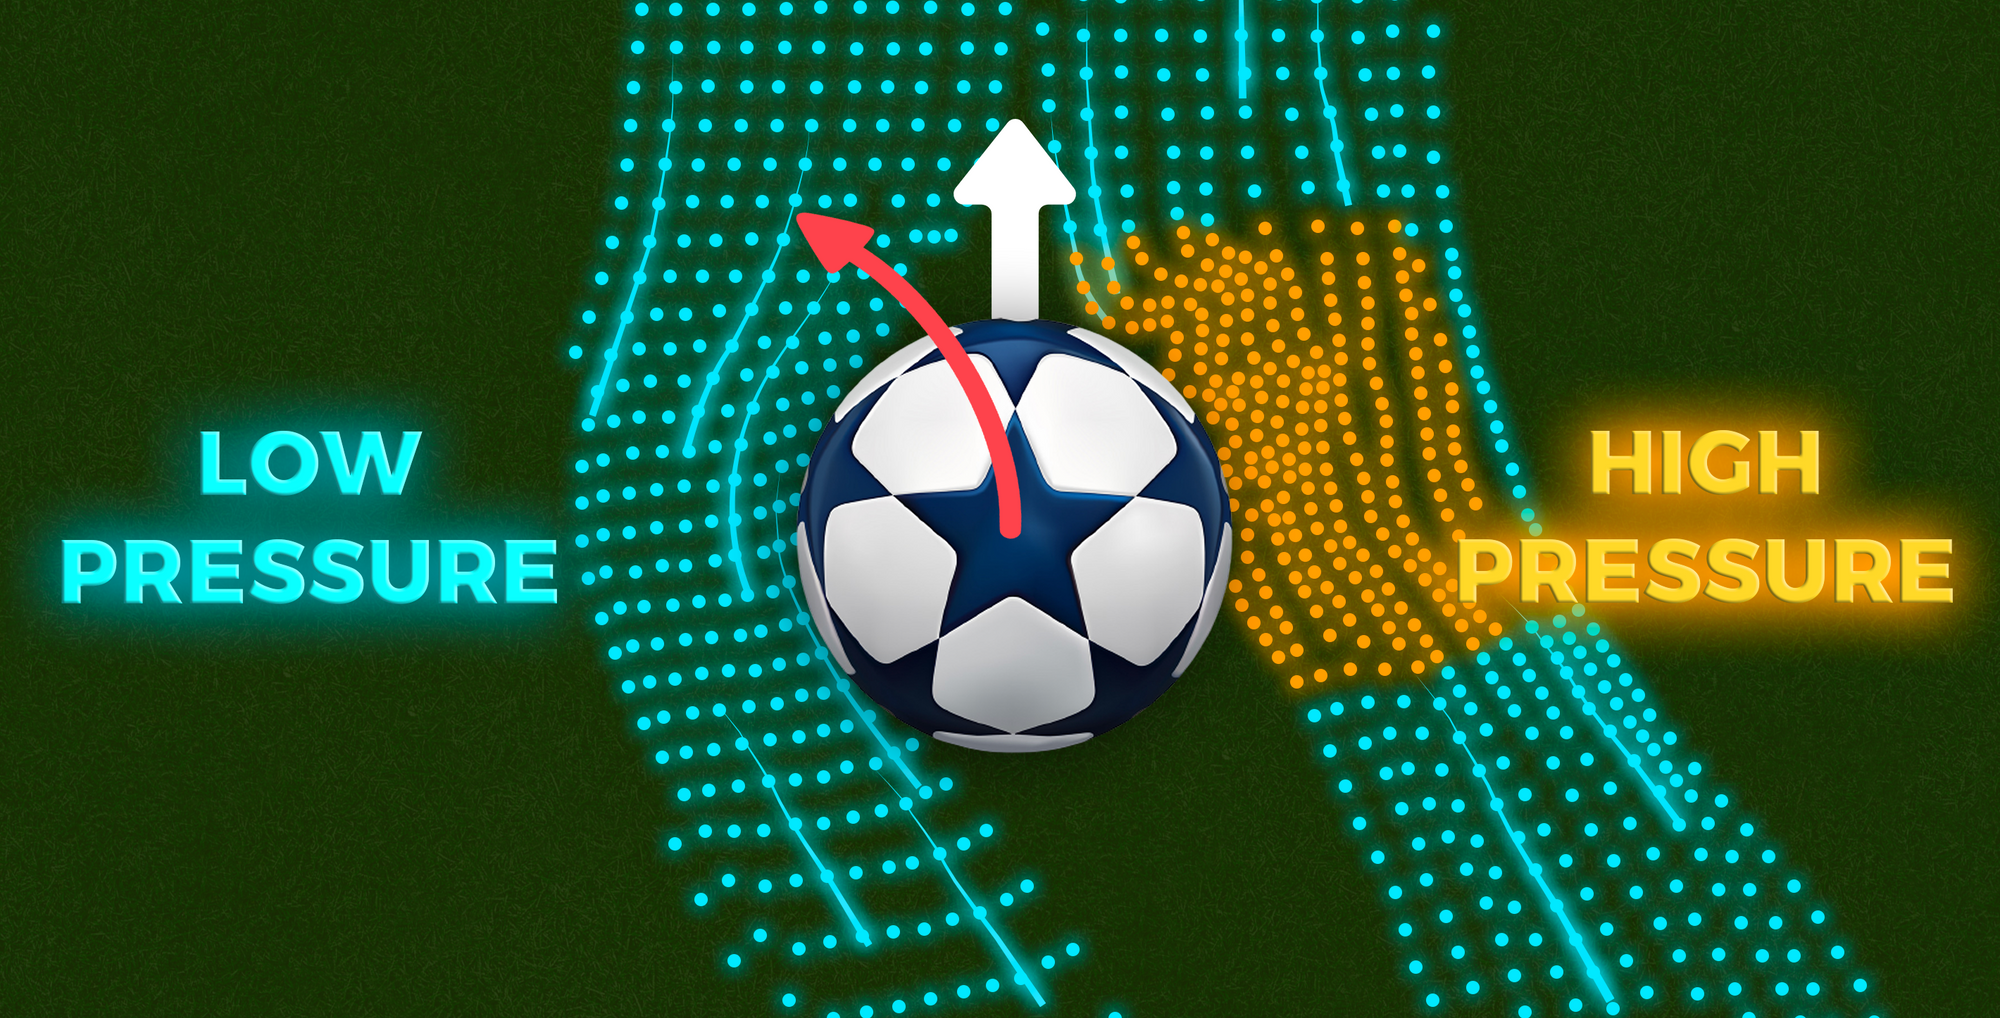
- When the player kicks the ball lateral from the rotational axis of the ball, a anticlockwise spin is induced
- As the ball spins through the air, the drag on the right side of the ball increases while drag on the left side decreases
- This causes a drag imbalance causing the left-hand side of the ball to be a low pressure region
- This causes the high pressure region to move the ball to the left-hand side
Bernoulli's Theorem & Spin 🌀
The Magnus effect is a perfect example of Bernoulli’s theorem, which is describing the conservation of energy appropriate for flowing fluids.
Bernoulli’s principle states that an increase in speed of a fluid occurs simultaneously with a decrease in pressure.
Bernoulli's Equation - A Quick Primer ⚡
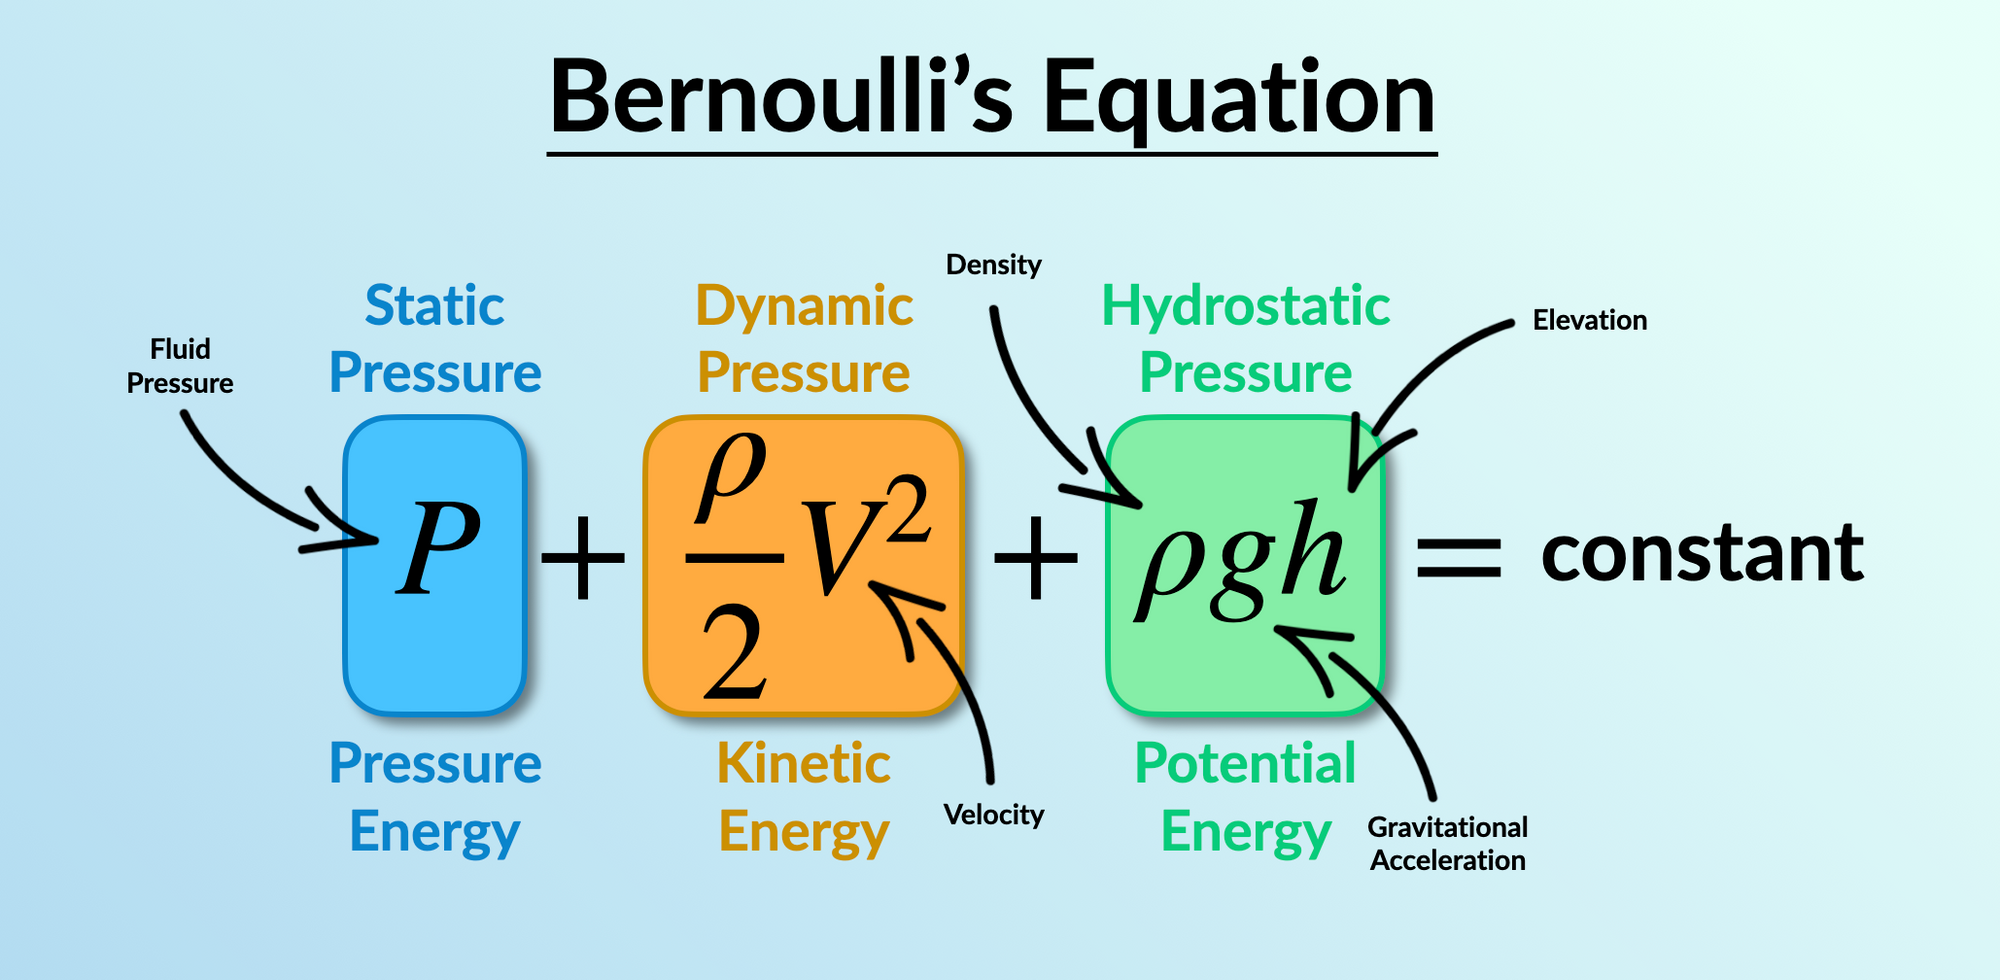
Bernoulli's equation reflects the idea that energy is conserved along a streamline – at least in inviscid flows that are also incompressible and time independent! The three terms can be thought of a representing the pressure energy, kinetic energy and potential energy of the fluid. The equation assumes that the overall sum of these energies doesn’t change along a streamline but the energy of the fluid is just being transferred between the different forms.
It is said that although Bernoulli discovered that pressure decreases when the flow speed increases, it was actually Leonhard Euler who created Bernoulli’s equation.
The behaviour of lowering fluid pressure in regions where the flow velocity is increased is usually labeled with the term "Bernoulli effect". It might seem very counterintuitive at first, but in order to move fluid through a constriction, the kinetic energy of a fluid must increase at the expense of pressure energy.
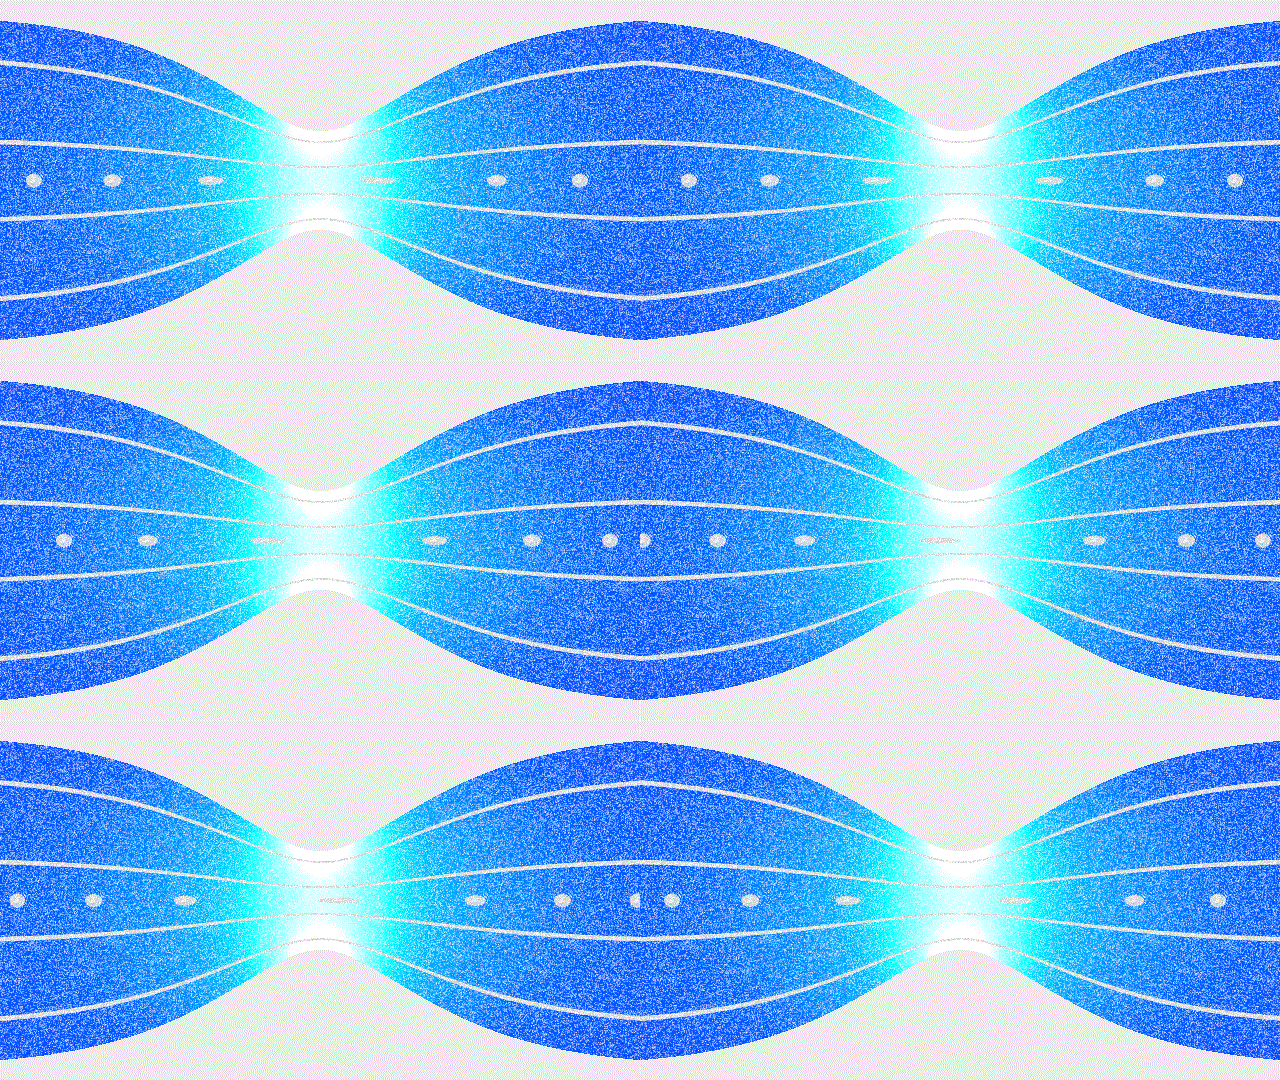
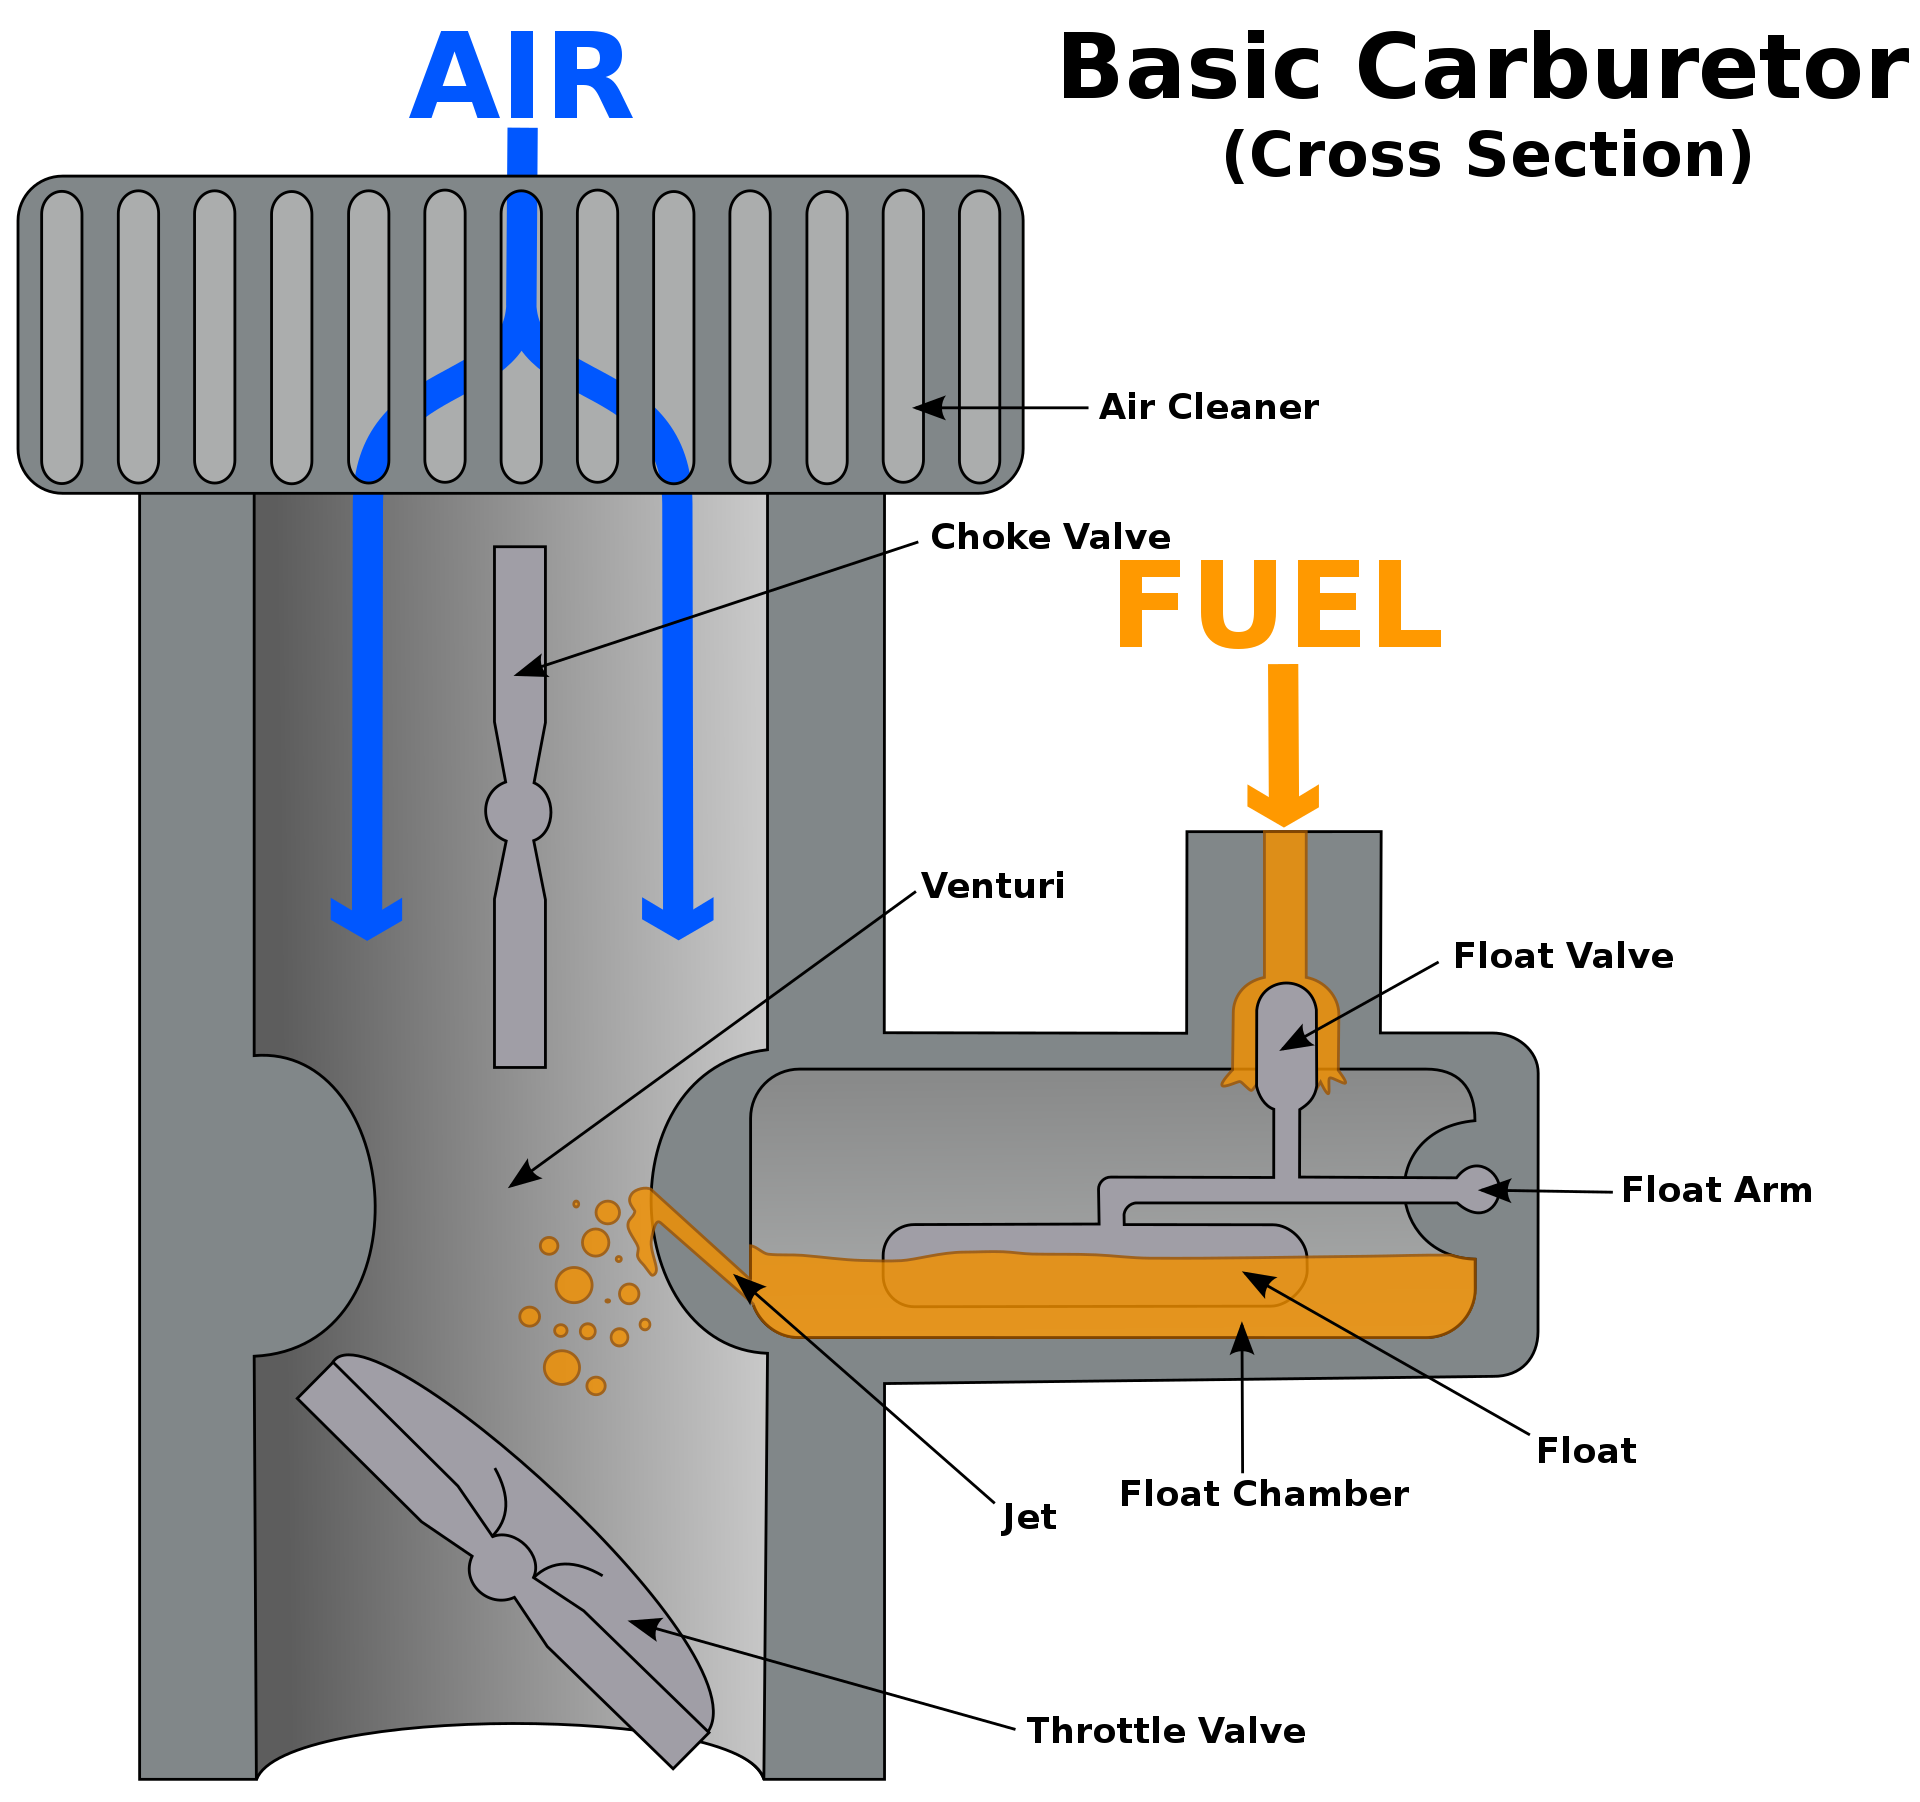
This can be best seen in the Venturi effect where a reduction in fluid pressure is caused by fluid flowing through a constricted section (or choke) of a pipe. In the case of a carburetor, the pressure difference causes fuel to be drawn into the air stream of the carburetor. When this occurs, air and fuel are mixed together, creating a fine spray of gas that allows the carburetor to function.
Most often, Bernoulli's theorem is also used to explain the lift of airplanes. Please do NOT do it as it has been debunked several times and people still get it wrong. A good paper on that topic has been published by Holger Babinski here.
No Spin Scenario ❌
If there is no spin, a so-called Kármán vortex street is formed behind (also called "wake") the ball. Whenever fluid flows around an obstacle, periodic vortex shedding can occur. This gives rise to so-called vortex streets, which not only occur frequently in engineering applications, but also nature.
This phenomenon can easily be analysed with modern CFD simulations.
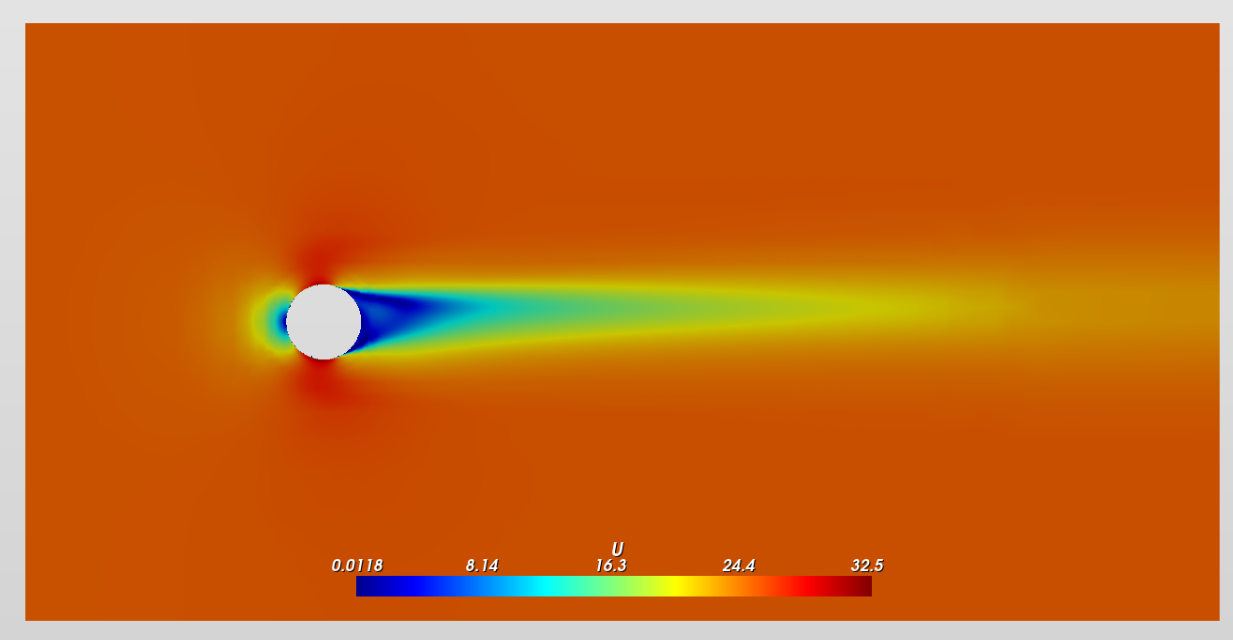
For our football, it will be subjected to force fluctuations with vortices detaching in the wake. The wakes formed behind the ball not only increase the drag, they also contribute to the fluttering motion that we can sometimes observe in baseball (knuckball).
Spin Scenario ✅
Let's now "turn on" our rotation inside our CFD model by either using something called a rotating wall boundary condition inside our model (rotatingWallVelocity). This "rotatingWallVelocity" can be used only for rotating wall (patch) that have all faces parallel with the rotation trajectory but has a significant drawback that the rotational velocity can only be applied tangentially to the surface.
This means that regions where the surfaces are largely normal to the desired velocity vector will not be represented accurately, since a large part of the velocity will be lost when projecting the vector to the surface. Not incredibly important for this simple qualitative analysis, but something to look out for!
Alternatively, we could also use the so-called Multiple Reference Frame (MRF) approach. This approach applies the rotation effect as an additional source term in the momentum equations, meaning that it is not necessary to physically rotate the mesh saving us a ton of resources!
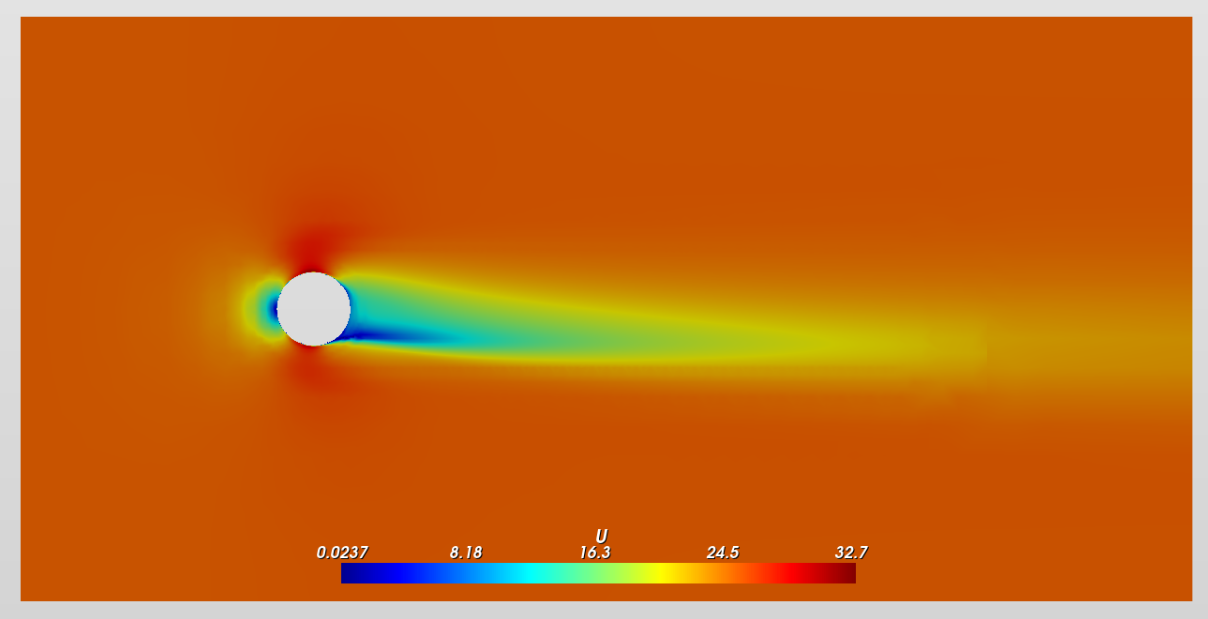
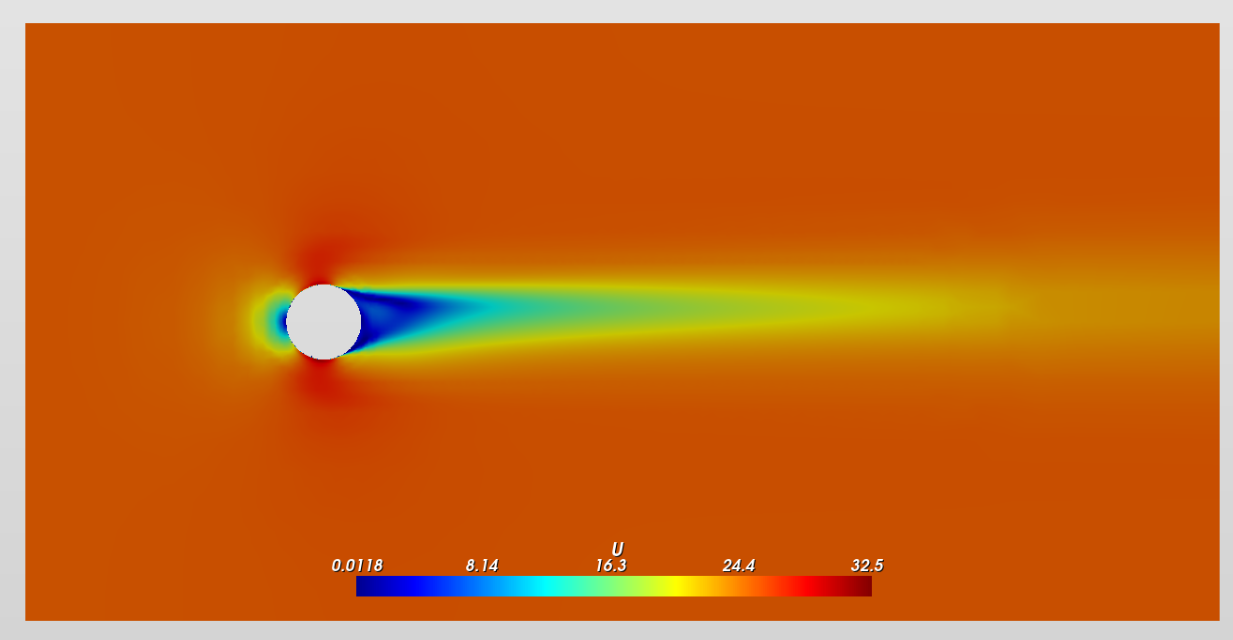

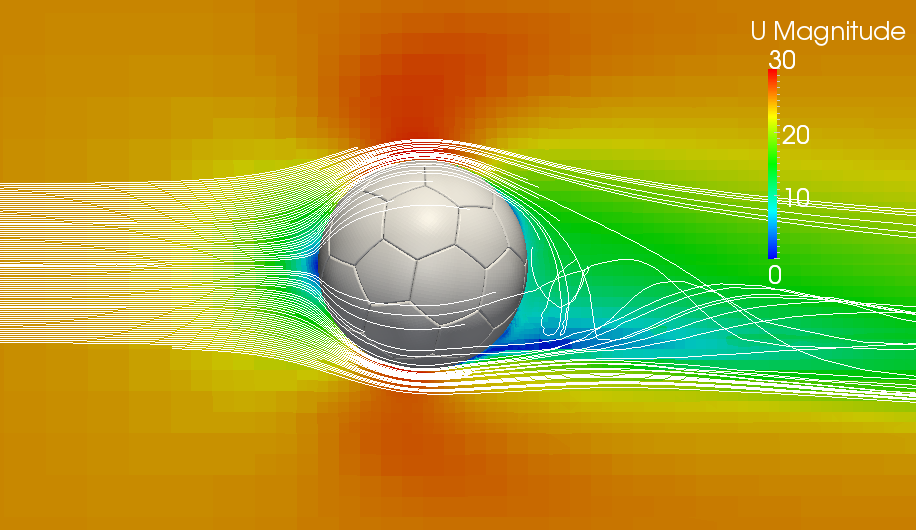
The MRF rotating zone is a steady-state approximation of the transient rotating motion at an “instance” of time. The mesh of the body is not physically rotated which would cause a lot of computational cost. This approach uses a rotating frame of reference that modifies the governing equations in the rotating zone.
As the rotation of the football is initiated, two zones are created. One zone with increased speed and negative relative pressure, and the other side with low speed and high pressure. The pressure difference creates a force that ultimately deflects the flight path. Using Bernoulli's equation, we can now intuitively explain what will happen in the high/low velocity regions when it comes to the pressure distribution.
Closing Remarks 📍
If you're up for a challenge, simulate your version of the Magnus effect and tag me on your socials using #MagnusEffectCFD and I will share & comment your post!
To get started with your first simulation or easily automate complete workflows, I highly recommend dicehub who enable cloud-based fluid dynamics simulations and make it very easy for beginners to set up their first CFD simulation.
If you’d like to see more simulation or fluid dynamics related blogs like this one, consider subscribing to my latest blogs, tutorials and course updates - and please feel free to leave a comment down below! 🙂
Keep engineering your mind! ❤️
Jousef

